← All posts

Monitoring Your NVIDIA DGX Spark with NVIDIA DCGM Exporter, Prometheus, and Grafana

A step-by-step guide to setting up persistent GPU monitoring on one or more NVIDIA DGX Spark systems using NVIDIA DCGM Exporter, Prometheus, and Grafana. Four files, one command, five minutes.

I have been running benchmarks and tests on NVIDIA DGX Spark for a while now. Every time I kick off a workload, I open a terminal and run nvidia-smi dmon on a loop (or nvtop when I want a prettier view). It works. But when you have two DGX Spark systems side by side and you are going back and forth between inference jobs, fine-tuning experiments, and container builds, that approach does not scale. You lose context. You cannot look back at what happened 10 minutes ago. And after I built the mini rack to house both DGX Spark systems, I wanted to keep a closer eye on their temperatures -- two machines stacked in a small enclosure with limited airflow is a different thermal story than one sitting on a desk.

I knew NVIDIA DCGM (Data Center GPU Manager) existed. What I did not know is that it works on DGX Spark out of the box. No special configuration. No hacks. Just a container with GPU access and it starts exposing metrics on port 9400.

This post walks through the setup I use to monitor one or more DGX Spark systems with NVIDIA DCGM Exporter, Prometheus, and Grafana. The whole thing is a single docker-compose.yml and takes about five minutes.

Architecture

The setup is minimal:

DGX Spark 1                     DGX Spark 2
┌──────────────────┐            ┌──────────────────┐
│  dcgm-exporter   │            │  dcgm-exporter   │
│  :9400           │            │  :9400           │
└──────────────────┘            └──────────────────┘
         │                               │
         └───────────┐   ┌───────────────┘
                     ▼   ▼
              ┌──────────────┐
              │  Prometheus  │
              │  :9090       │
              └──────┬───────┘
                     │
              ┌──────▼───────┐
              │   Grafana    │
              │  :3000       │
              └──────────────┘

Prometheus and Grafana run on one of the Sparks (or anywhere on the same network). DCGM Exporter runs on each Spark you want to monitor. Prometheus scrapes all exporters and Grafana queries Prometheus.

What You Need

  • One or more NVIDIA DGX Spark systems
  • Docker and Docker Compose installed (both are available on DGX Spark)
  • Network connectivity between your DGX Spark systems (if monitoring more than one)

Step 1: Deploy DCGM Exporter on Each Spark

On every DGX Spark you want to monitor, run the NVIDIA DCGM Exporter container. If you are running the full stack (Prometheus + Grafana) on the same machine, this is included in the compose file below. For remote DGX Spark systems, run it standalone:

docker run -d \
  --name dcgm-exporter \
  --restart unless-stopped \
  --cap-add SYS_ADMIN \
  --gpus all \
  -p 9400:9400 \
  nvcr.io/nvidia/k8s/dcgm-exporter:4.5.2-4.8.1-distroless

Verify it is working:

curl -s http://localhost:9400/metrics | grep DCGM_FI_DEV_GPU_UTIL

You should see something like:

DCGM_FI_DEV_GPU_UTIL{gpu="0",UUID="GPU-...",device="nvidia0",modelName="NVIDIA GB10",...} 0

That zero means the GPU is idle. The important thing is that the metric exists and the exporter is responding.

Note: The --cap-add SYS_ADMIN flag is required for profiling metrics (DCGM_FI_PROF_*) and is included in the official quickstart command. It is recommended to include it for full metric coverage.

Step 2: Set Up the Monitoring Stack

On the Spark where you want to run Prometheus and Grafana, create a project directory:

mkdir -p ~/monitoring/provisioning/datasources
cd ~/monitoring

docker-compose.yml

This file defines all three services. If this is also one of the Sparks you want to monitor, the DCGM Exporter is included here:

services:
  dcgm-exporter:
    image: nvcr.io/nvidia/k8s/dcgm-exporter:4.5.2-4.8.1-distroless
    container_name: dcgm-exporter
    restart: unless-stopped
    cap_add:
      - SYS_ADMIN
    ports:
      - "9400:9400"
    deploy:
      resources:
        reservations:
          devices:
            - driver: nvidia
              count: all
              capabilities: [gpu]

  prometheus:
    image: prom/prometheus:latest
    container_name: prometheus
    restart: unless-stopped
    ports:
      - "9090:9090"
    volumes:
      - ./prometheus.yml:/etc/prometheus/prometheus.yml
      - prometheus_data:/prometheus

  grafana:
    image: grafana/grafana:latest
    container_name: grafana
    restart: unless-stopped
    ports:
      - "3000:3000"
    environment:
      - GF_SECURITY_ADMIN_PASSWORD=admin
    volumes:
      - grafana_data:/var/lib/grafana
      - ./provisioning/datasources:/etc/grafana/provisioning/datasources

volumes:
  prometheus_data:
  grafana_data:

prometheus.yml

Replace the IP addresses with the actual IPs of your DGX Spark systems. If you only have one, remove the second job:

global:
  scrape_interval: 15s

scrape_configs:
  - job_name: 'dcgm-exporter-spark1'
    static_configs:
      - targets: ['<SPARK1_IP>:9400']
        labels:
          instance: 'spark1'

  - job_name: 'dcgm-exporter-spark2'
    static_configs:
      - targets: ['<SPARK2_IP>:9400']
        labels:
          instance: 'spark2'

If Prometheus runs on the same machine as one of the exporters, you can use the Docker service name dcgm-exporter:9400 instead of the IP for that target.

provisioning/datasources/prometheus.yml

This file tells Grafana where to find Prometheus automatically, so you do not have to configure the datasource manually through the UI:

apiVersion: 1

datasources:
  - name: Prometheus
    type: prometheus
    access: proxy
    url: http://prometheus:9090
    isDefault: true
    editable: true
    jsonData:
      timeInterval: "15s"

Start Everything

docker compose up -d

Verify all containers are running:

docker ps --format "table {{.Names}}\t{{.Status}}"
NAMES           STATUS
grafana         Up 10 seconds
prometheus      Up 10 seconds
dcgm-exporter   Up 10 seconds

Step 3: Verify the Pipeline

Before touching Grafana, confirm that Prometheus is scraping the exporters. Open http://<SPARK_IP>:9090/targets in your browser. Both targets should show a green UP status.

You can also query a metric directly in the Prometheus UI:

DCGM_FI_DEV_GPU_TEMP

This should return the current GPU temperature for each Spark.

Step 4: Import the Grafana Dashboard

Open Grafana at http://<SPARK_IP>:3000 and log in with admin / admin (or whatever password you set in the compose file).

Go to Dashboards > New > Import and paste the following JSON:

Dashboard JSON (click to expand)
{
  "annotations": { "list": [] },
  "editable": true,
  "graphTooltip": 1,
  "panels": [
    {
      "collapsed": false,
      "gridPos": { "h": 1, "w": 24, "x": 0, "y": 0 },
      "id": 100,
      "title": "GPU Overview",
      "type": "row"
    },
    {
      "datasource": { "type": "prometheus" },
      "fieldConfig": {
        "defaults": {
          "color": { "mode": "thresholds" },
          "thresholds": { "steps": [{ "color": "green", "value": null }, { "color": "yellow", "value": 70 }, { "color": "red", "value": 90 }] },
          "unit": "percent", "min": 0, "max": 100
        }
      },
      "gridPos": { "h": 6, "w": 6, "x": 0, "y": 1 },
      "id": 1,
      "options": { "orientation": "auto", "reduceOptions": { "calcs": ["lastNotNull"], "fields": "", "values": false }, "showThresholdLabels": false, "showThresholdMarkers": true },
      "title": "GPU Utilization",
      "type": "gauge",
      "targets": [{ "expr": "DCGM_FI_DEV_GPU_UTIL", "legendFormat": "{{instance}}", "refId": "A" }]
    },
    {
      "datasource": { "type": "prometheus" },
      "fieldConfig": {
        "defaults": {
          "color": { "mode": "thresholds" },
          "thresholds": { "steps": [{ "color": "green", "value": null }, { "color": "yellow", "value": 70 }, { "color": "red", "value": 90 }] },
          "unit": "percent", "min": 0, "max": 100
        }
      },
      "gridPos": { "h": 6, "w": 6, "x": 6, "y": 1 },
      "id": 2,
      "options": { "orientation": "auto", "reduceOptions": { "calcs": ["lastNotNull"], "fields": "", "values": false }, "showThresholdLabels": false, "showThresholdMarkers": true },
      "title": "Memory Bandwidth Utilization",
      "type": "gauge",
      "targets": [{ "expr": "DCGM_FI_DEV_MEM_COPY_UTIL", "legendFormat": "{{instance}}", "refId": "A" }]
    },
    {
      "datasource": { "type": "prometheus" },
      "fieldConfig": {
        "defaults": {
          "color": { "mode": "thresholds" },
          "thresholds": { "steps": [{ "color": "green", "value": null }, { "color": "yellow", "value": 70 }, { "color": "orange", "value": 80 }, { "color": "red", "value": 90 }] },
          "unit": "celsius", "min": 20, "max": 100
        }
      },
      "gridPos": { "h": 6, "w": 6, "x": 12, "y": 1 },
      "id": 3,
      "options": { "orientation": "auto", "reduceOptions": { "calcs": ["lastNotNull"], "fields": "", "values": false }, "showThresholdLabels": false, "showThresholdMarkers": true },
      "title": "GPU Temperature",
      "type": "gauge",
      "targets": [{ "expr": "DCGM_FI_DEV_GPU_TEMP", "legendFormat": "{{instance}}", "refId": "A" }]
    },
    {
      "datasource": { "type": "prometheus" },
      "fieldConfig": {
        "defaults": {
          "color": { "mode": "thresholds" },
          "thresholds": { "steps": [{ "color": "super-light-blue", "value": null }, { "color": "green", "value": 30 }, { "color": "yellow", "value": 180 }, { "color": "red", "value": 250 }] },
          "unit": "watt", "min": 0, "max": 300
        }
      },
      "gridPos": { "h": 6, "w": 6, "x": 18, "y": 1 },
      "id": 4,
      "options": { "orientation": "auto", "reduceOptions": { "calcs": ["lastNotNull"], "fields": "", "values": false }, "showThresholdLabels": false, "showThresholdMarkers": true },
      "title": "Power Draw",
      "type": "gauge",
      "targets": [{ "expr": "DCGM_FI_DEV_POWER_USAGE", "legendFormat": "{{instance}}", "refId": "A" }]
    },
    {
      "collapsed": false,
      "gridPos": { "h": 1, "w": 24, "x": 0, "y": 7 },
      "id": 101,
      "title": "Utilization Over Time",
      "type": "row"
    },
    {
      "datasource": { "type": "prometheus" },
      "fieldConfig": {
        "defaults": {
          "color": { "mode": "palette-classic" },
          "custom": { "drawStyle": "line", "fillOpacity": 25, "lineInterpolation": "linear", "lineWidth": 2, "showPoints": "never", "spanNulls": false, "stacking": { "mode": "none" }, "gradientMode": "opacity" },
          "unit": "percent", "min": 0, "max": 100
        }
      },
      "gridPos": { "h": 9, "w": 12, "x": 0, "y": 8 },
      "id": 10,
      "options": { "legend": { "calcs": ["mean", "max", "lastNotNull"], "displayMode": "table", "placement": "bottom" }, "tooltip": { "mode": "multi", "sort": "desc" } },
      "title": "GPU Utilization %",
      "type": "timeseries",
      "targets": [{ "expr": "DCGM_FI_DEV_GPU_UTIL", "legendFormat": "{{instance}}", "refId": "A" }]
    },
    {
      "datasource": { "type": "prometheus" },
      "fieldConfig": {
        "defaults": {
          "color": { "mode": "palette-classic" },
          "custom": { "drawStyle": "line", "fillOpacity": 25, "lineInterpolation": "linear", "lineWidth": 2, "showPoints": "never", "spanNulls": false, "stacking": { "mode": "none" }, "gradientMode": "opacity" },
          "unit": "percent", "min": 0, "max": 100
        }
      },
      "gridPos": { "h": 9, "w": 12, "x": 12, "y": 8 },
      "id": 11,
      "options": { "legend": { "calcs": ["mean", "max", "lastNotNull"], "displayMode": "table", "placement": "bottom" }, "tooltip": { "mode": "multi", "sort": "desc" } },
      "title": "Memory Bandwidth Utilization %",
      "type": "timeseries",
      "targets": [{ "expr": "DCGM_FI_DEV_MEM_COPY_UTIL", "legendFormat": "{{instance}}", "refId": "A" }]
    },
    {
      "collapsed": false,
      "gridPos": { "h": 1, "w": 24, "x": 0, "y": 17 },
      "id": 102,
      "title": "Thermal & Power",
      "type": "row"
    },
    {
      "datasource": { "type": "prometheus" },
      "fieldConfig": {
        "defaults": {
          "color": { "mode": "palette-classic" },
          "custom": { "drawStyle": "line", "fillOpacity": 15, "lineInterpolation": "linear", "lineWidth": 2, "showPoints": "never", "spanNulls": false, "stacking": { "mode": "none" }, "gradientMode": "opacity" },
          "unit": "celsius"
        }
      },
      "gridPos": { "h": 9, "w": 12, "x": 0, "y": 18 },
      "id": 20,
      "options": { "legend": { "calcs": ["mean", "max", "lastNotNull"], "displayMode": "table", "placement": "bottom" }, "tooltip": { "mode": "multi", "sort": "desc" } },
      "title": "GPU Temperature",
      "type": "timeseries",
      "targets": [{ "expr": "DCGM_FI_DEV_GPU_TEMP", "legendFormat": "{{instance}}", "refId": "A" }]
    },
    {
      "datasource": { "type": "prometheus" },
      "fieldConfig": {
        "defaults": {
          "color": { "mode": "palette-classic" },
          "custom": { "drawStyle": "line", "fillOpacity": 15, "lineInterpolation": "linear", "lineWidth": 2, "showPoints": "never", "spanNulls": false, "stacking": { "mode": "none" }, "gradientMode": "opacity" },
          "unit": "watt"
        }
      },
      "gridPos": { "h": 9, "w": 12, "x": 12, "y": 18 },
      "id": 21,
      "options": { "legend": { "calcs": ["mean", "max", "lastNotNull"], "displayMode": "table", "placement": "bottom" }, "tooltip": { "mode": "multi", "sort": "desc" } },
      "title": "Power Draw (W)",
      "type": "timeseries",
      "targets": [{ "expr": "DCGM_FI_DEV_POWER_USAGE", "legendFormat": "{{instance}}", "refId": "A" }]
    },
    {
      "collapsed": false,
      "gridPos": { "h": 1, "w": 24, "x": 0, "y": 27 },
      "id": 103,
      "title": "Clock & Energy",
      "type": "row"
    },
    {
      "datasource": { "type": "prometheus" },
      "fieldConfig": {
        "defaults": {
          "color": { "mode": "palette-classic" },
          "custom": { "drawStyle": "line", "fillOpacity": 15, "lineInterpolation": "linear", "lineWidth": 2, "showPoints": "never", "spanNulls": false, "stacking": { "mode": "none" }, "gradientMode": "opacity" },
          "unit": "none"
        }
      },
      "gridPos": { "h": 9, "w": 12, "x": 0, "y": 28 },
      "id": 30,
      "options": { "legend": { "calcs": ["mean", "max", "lastNotNull"], "displayMode": "table", "placement": "bottom" }, "tooltip": { "mode": "multi", "sort": "desc" } },
      "title": "SM Clock (MHz)",
      "type": "timeseries",
      "targets": [{ "expr": "DCGM_FI_DEV_SM_CLOCK", "legendFormat": "{{instance}}", "refId": "A" }]
    },
    {
      "datasource": { "type": "prometheus" },
      "fieldConfig": {
        "defaults": {
          "color": { "mode": "palette-classic" },
          "custom": { "drawStyle": "line", "fillOpacity": 15, "lineInterpolation": "linear", "lineWidth": 2, "showPoints": "never", "spanNulls": false, "stacking": { "mode": "none" }, "gradientMode": "opacity" },
          "unit": "watt"
        }
      },
      "gridPos": { "h": 9, "w": 12, "x": 12, "y": 28 },
      "id": 31,
      "options": { "legend": { "calcs": ["mean", "max", "lastNotNull"], "displayMode": "table", "placement": "bottom" }, "tooltip": { "mode": "multi", "sort": "desc" } },
      "title": "Energy Consumption Rate (W)",
      "type": "timeseries",
      "targets": [{ "expr": "rate(DCGM_FI_DEV_TOTAL_ENERGY_CONSUMPTION[1m]) / 1000", "legendFormat": "{{instance}}", "refId": "A" }]
    },
    {
      "collapsed": false,
      "gridPos": { "h": 1, "w": 24, "x": 0, "y": 37 },
      "id": 104,
      "title": "PCIe Health",
      "type": "row"
    },
    {
      "datasource": { "type": "prometheus" },
      "fieldConfig": {
        "defaults": {
          "color": { "mode": "palette-classic" },
          "custom": { "drawStyle": "line", "fillOpacity": 10, "lineInterpolation": "stepAfter", "lineWidth": 2, "showPoints": "never", "spanNulls": false, "stacking": { "mode": "none" } },
          "unit": "none"
        }
      },
      "gridPos": { "h": 7, "w": 24, "x": 0, "y": 38 },
      "id": 40,
      "options": { "legend": { "calcs": ["lastNotNull", "max"], "displayMode": "table", "placement": "bottom" }, "tooltip": { "mode": "multi", "sort": "desc" } },
      "title": "PCIe Replay Counter",
      "type": "timeseries",
      "targets": [
        { "expr": "DCGM_FI_DEV_PCIE_REPLAY_COUNTER", "legendFormat": "Total retries - {{instance}}", "refId": "A" },
        { "expr": "rate(DCGM_FI_DEV_PCIE_REPLAY_COUNTER[5m])", "legendFormat": "Retry rate/s - {{instance}}", "refId": "B" }
      ]
    }
  ],
  "schemaVersion": 39,
  "tags": ["nvidia", "gpu", "dgx-spark", "dcgm", "gb10"],
  "templating": { "list": [] },
  "time": { "from": "now-30m", "to": "now" },
  "refresh": "15s",
  "timezone": "",
  "title": "DGX Spark GPU Monitoring",
  "uid": "dgx-spark-gpu-v3",
  "version": 1
}

Click Load, then Import. The dashboard should immediately start showing data.

What You Get

Grafana dashboard showing GPU utilization, temperature, power draw, and clock speeds for two DGX Spark systems under load

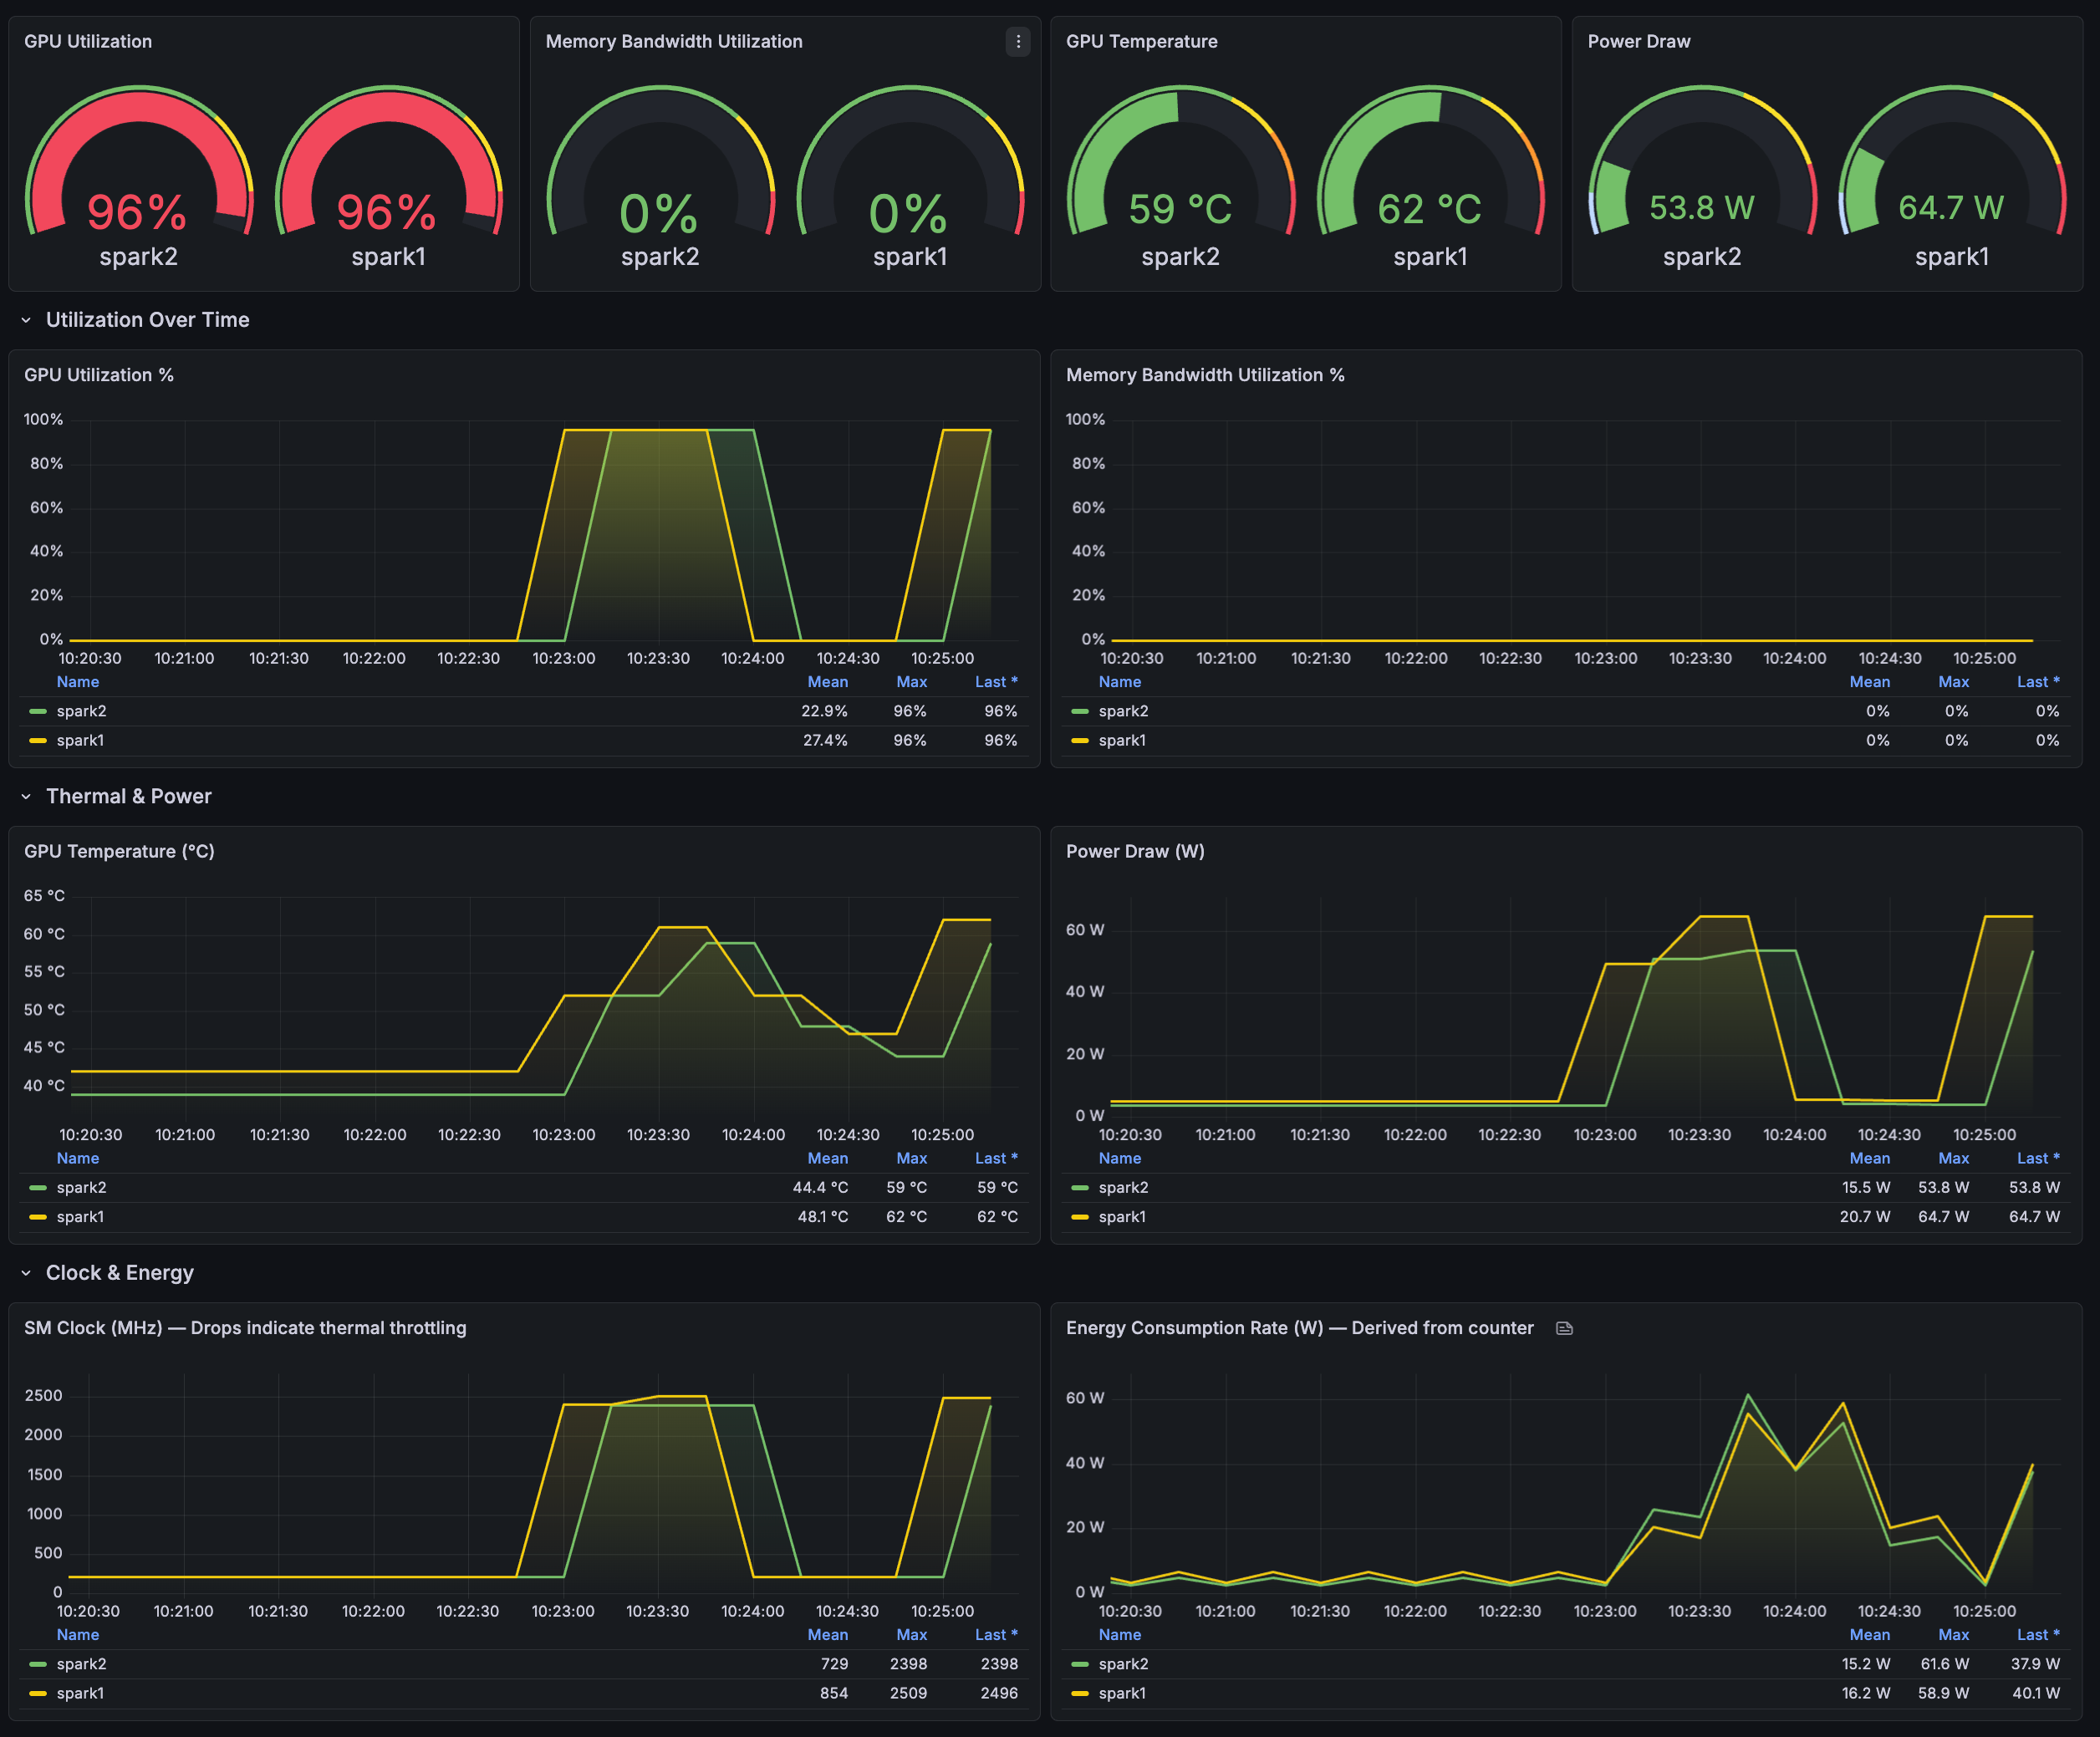
The dashboard has five sections:

GPU Overview -- Gauge panels showing the current state at a glance: GPU utilization, memory bandwidth utilization, temperature, and power draw. One reading per Spark.

Utilization Over Time -- Time series charts for GPU compute utilization and memory bandwidth. This is where you see how your workloads behave over time. Sustained 90%+ utilization during training means your GPU is being used well. Spikes followed by drops might indicate data loading bottlenecks.

Thermal & Power -- Temperature and power draw over time. DGX Spark has no fan control to adjust, but tracking temperature helps you understand if your environment or placement is adequate. Users on the NVIDIA Developer Forums have reported GPU temperatures in the 77-82 range under load. Monitoring temperature trends over time helps you identify whether your enclosure or environment needs better airflow.

Clock & Energy -- SM clock frequency and energy consumption rate. A drop in SM clock during a workload can be a sign of thermal management kicking in. The energy consumption panel uses rate() on the DCGM energy counter to derive watts -- useful for tracking power cost over long experiments.

PCIe Health -- PCIe replay counter. This should stay at zero. Non-zero values indicate link-level retransmissions, which can point to hardware or bus integrity issues.

Key Metrics Reference

All metric names below are DCGM field identifiers documented in the DCGM source.

MetricTypeWhat It Tells You
DCGM_FI_DEV_GPU_UTILGaugeGPU compute utilization (0-100%)
DCGM_FI_DEV_MEM_COPY_UTILGaugeMemory bandwidth utilization (0-100%)
DCGM_FI_DEV_GPU_TEMPGaugeGPU die temperature in Celsius
DCGM_FI_DEV_POWER_USAGEGaugeCurrent power draw in watts
DCGM_FI_DEV_SM_CLOCKGaugeStreaming multiprocessor clock in MHz
DCGM_FI_DEV_TOTAL_ENERGY_CONSUMPTIONCounterCumulative energy since boot in millijoules
DCGM_FI_DEV_PCIE_REPLAY_COUNTERCounterCumulative PCIe retransmission count

Adding More DGX Spark Systems

To monitor a third DGX Spark, two things are needed:

  1. Run dcgm-exporter on the new machine (the standalone docker run command from Step 1).

  2. Add a new scrape job to prometheus.yml:

  - job_name: 'dcgm-exporter-spark3'
    static_configs:
      - targets: ['<SPARK3_IP>:9400']
        labels:
          instance: 'spark3'

Restart Prometheus (docker restart prometheus) and the new DGX Spark appears in all panels automatically. No dashboard changes needed -- the queries use {{instance}} in the legend, so each system gets its own line.

Some other things to pay attention

Datasource URL must use the Docker service name. If Grafana and Prometheus are in the same compose file, the Prometheus URL in the datasource must be http://prometheus:9090, not http://localhost:9090. Inside the Grafana container, localhost refers to the container itself. This is the most common reason for dashboards showing no data or erratic readings.

Scrape interval matters. A 15-second interval is a good balance. Going lower (like 5 seconds) creates more data without adding much value for GPU monitoring, and can cause visual noise in the charts.

DCGM Exporter needs SYS_ADMIN for full metric coverage. The --cap-add SYS_ADMIN flag is required for profiling metrics (DCGM_FI_PROF_*). The official quickstart includes it, and it is recommended for a complete monitoring setup.

Final Thoughts

The whole setup is four files and one command. Once it is running, you get persistent GPU monitoring with no manual effort. You can leave it running in the background while you iterate on your experiments, and go back to look at what happened during that training run that crashed at 3am.

For me, the biggest value is comparison. When you run the same benchmark on two DGX Spark systems and one finishes faster, you can look at the utilization curves side by side and understand why. That is harder to do with nvidia-smi in two terminals.